
Our Mission: Empower Do-It-Yourself Investors with Free Academic-based Research & Resources for Life-long Investing
Resiliency — How Fast Do Different Asset Classes Recover?
By Chris Pedersen
We live at an amazing time. Today, there is more information available about historical investment asset class performance than ever before, and much of it is available for free on the Internet. One of my favorite resources for investing data is the Portfolio Visualizer website, and one of the questions it recently let me answer is “how do different US asset classes perform in market downturns?”
To answer the question, I looked at two different kinds of analysis on the website: backtesting, which analyzes the historical sequence of returns, and Monte Carlo simulation which scrambles the history to create a larger number of imagined possible future scenarios. The backtesting tells us how each asset class has performed during downturns in the past, and the Monte Carlo simulation attempts to tell us how they might perform in the future. There are, of course, no guarantees, but since the past is our only guide to the future, I think it’s still worth a look.
Here’s the backtesting return data for the four US equity asset classes in the Ultimate Buy & Hold Portfolio (I’m limiting analysis to these because they have the longest histories available).
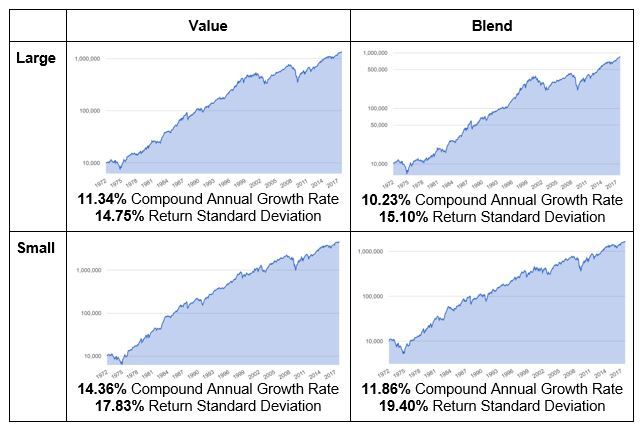
Not surprisingly, small and value have delivered higher returns in the past, and small is more volatile (higher return standard deviation) than large. There is a surprise though. The return standard deviation for value is lower than blend. This runs counter to the idea that higher returns for value are compensation for less predictable (or riskier) performance.
Now, let’s look at what the backtesting history says about performance in market downturns. Here’s the drawdown (balance decline) data for each asset class.
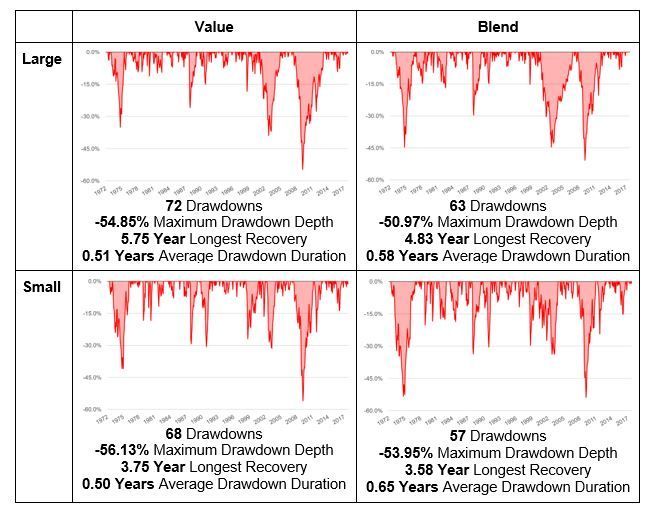
Again, we see a mix of the expected and unexpected. As expected, the asset class with the highest historical return (small cap value) also goes down the most in bad markets. The surprises here are: it only goes down by about 2% to 5% more than the other asset classes; it recovered from drawdowns the fastest on average (0.50 years); and it had the second-fastest (3.75 years) recovery time from the worst drawdown. Usually, I think of value investing, and particularly small-cap-value investing as requiring more patience, but this data suggests it’s the large-cap-value, and large-blend investors who need the most patience in waiting for their portfolios to recover. I suspect the reason small-cap-value investors are warned that they need patience has more to do with tracking error since they are likely to see periods of a year or more when the highly-visible S&P500 is outperforming their investments.
Next, we’ll look at the Monte Carlo simulations to see what they tell us about these asset classes recovering from drawdowns. The simulator lets us specify a “Sequence of Returns Risk,” which I’ve set to have the worst year in the 50 year simulation happen in the first year. I’ve also selected the “Logarithmic scale” option to make it easier to see what’s going on in the early years since it stretches out the smaller numbers and compresses the big ones. These charts look complicated, but they’re really just showing a range of likely investment balances over time. The middle line is the 50th percentile, so there’s a 50% chance of being higher, and 50% chance of being lower. If we go up and down one line from the center, to the 25th and 75th percentile lines, we’d expect the balance to be between those lines 50% of the time. The top and bottom lines are the 90th and 10th percentile lines. We’d expect the balance of the portfolio to fall between them 80% of the time. For our analysis, I’ll focus on the bottom line, since that’s the 10th percentile worst case scenario. When that line goes above the starting balance (10,000), there’s a 90% chance the simulated portfolio will have recovered from the worst-case downturns modeled in the first year.
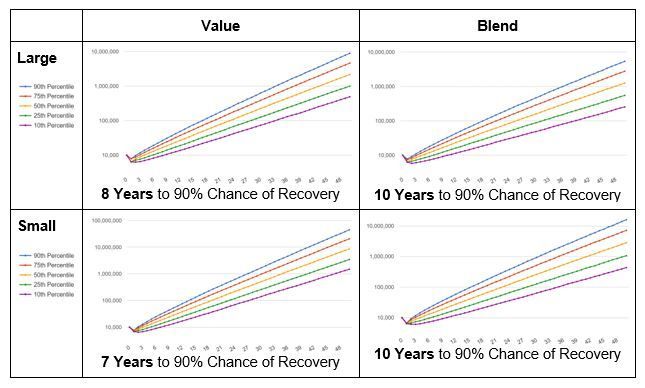
The Monte Carlo simulation uses the same historical data as the backtesting, but it randomly scrambles it to create more scenarios than we have in the historical record. As a result, it tends to come up with bigger extremes on the low and high end. Although that results in longer downturns, small-cap-value still has the shortest recovery time. Once again, it’s surprising that the asset class with the highest historical return, small-cap-value, also has faster Monte Carlo simulated recovery times.
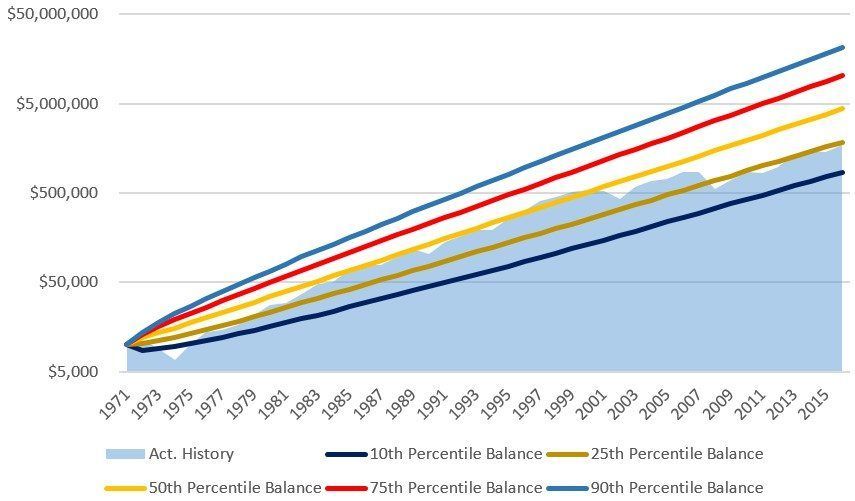
Finally, what happens if we combine large-cap-blend, large-cap-value, small-cap-blend, and small-cap-value in a balanced portfolio of 25% each with annual rebalancing? For this example, I’ve used the Portfolio Visualizer download data feature & overlayed the historical returns over the simulation ranges. I’ve also left the stress-test worst-year-first feature turned on.
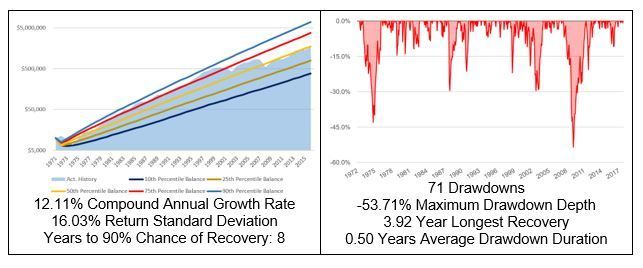
The history and simulations show the benefits of diversification. The back-tested compound growth rate is higher than all but the small-cap-value asset class, and the maximum drawdown depth is better (less) than all but large-cap blend. The longest recovery time of 3.92 years is only slightly worse than small-blend at 3.58 years and small-cap-value at 3.75 years over the same time period.
The overlay of the historical data and the Monte Carlo simulated ranges is also interesting because the line up pretty well. In fact, if you remove the stress-test worst-year-first, they line up even better:
There is one year (1974) that’s below the 10th percentile, but that’s not too surprising given there are 45 years of history in the simulation. I think this is a very interesting tool to augment Paul’s fine tuning tables in helping set investor expectations for the “ride” their portfolio choices are likely to produce.
So, what do we learn from all this data and analysis? Here’s a summary:
- Small and value asset classes have had greater long-term returns than large and blend
- Value asset classes are not necessarily more volatile than blend
- Small-cap-value drawdowns were only 2%-5% more than large and blend
- Large-cap-value and large-cap-blend took the longest to recover from their worst market downturns (5.75 years and 4.83 years respectively)
- Small-cap-value and small-cap-blend have recovered the fastest from their worst market downturns (3.75 years and 3.58 years respectively)
- Monte Carlo simulations can help set reasonable expectations about future investment performance for specific portfolio allocations
- Monte Carlo simulations also suggest that small-cap-value will recover faster than large and blend asset classes in future downturns