
The Merriman Educational Foundation creates numerous artifacts each year and publishes them in an annual “Best Advice” series. These tables and charts are used to demonstrate the history of investment strategies, equity/fixed-income allocations, growth, and fixed/flexible distributions from 1970 until today.
We identified that the foundation’s community of individual investors, partner organizations, and stakeholders could benefit from an interactive version of these static assets. We built the Merriman Foundation Lifetime Investment Calculator to meet this need. The calculator aims to bring the annual Merriman Best Advice to life so that community members can enter their own analysis, dive deeper into the recommended Merriman strategies, and draw conclusions from the foundation’s work.
The Merriman Financial Education Foundation Lifetime Investment Calculator is built from the Fine Tuning Your Asset Allocation 2024 update tables. We don’t know the future, but the past contains many events that could happen again. The last 54 years include numerous wars, booms, busts, and periods of high and low inflation. We consider these last 54 years a sequence of returns and have chosen to loop through this 54 year sequence to support calculating up to 200 years of returns.
Parameters
| Name | Description | Options/Range |
|---|---|---|
| Strategy | Choose from the 11 Merriman strategies that you have been hearing about for years. The first number relates to the fine tuning table presented in early 2022. | B1: S&P 500 B2a: Ultimate Buy and Hold Worldwide (50% US/50% International) B2b: Ultimate Buy and Hold Worldwide (70% US/30% International) B3a: 4-Fund Combo Worldwide (50% US/50% International) B3b: 4-Fund Combo Worldwide (70% US/30% International) B4: 4-Fund combo US only B5a: All Value Worldwide (50% US/50% International) B5b: All Value Worldwide(70% US/30% International) B6: All Value US B7a: All Small Cap Value Worldwide (50% US/50% International) B7b: All Small Cap Value Worldwide (70% US/30% International) B8: All Small Cap Value US B9: US 2-Fund (50% S&P 500/50% All Small Cap Value) |
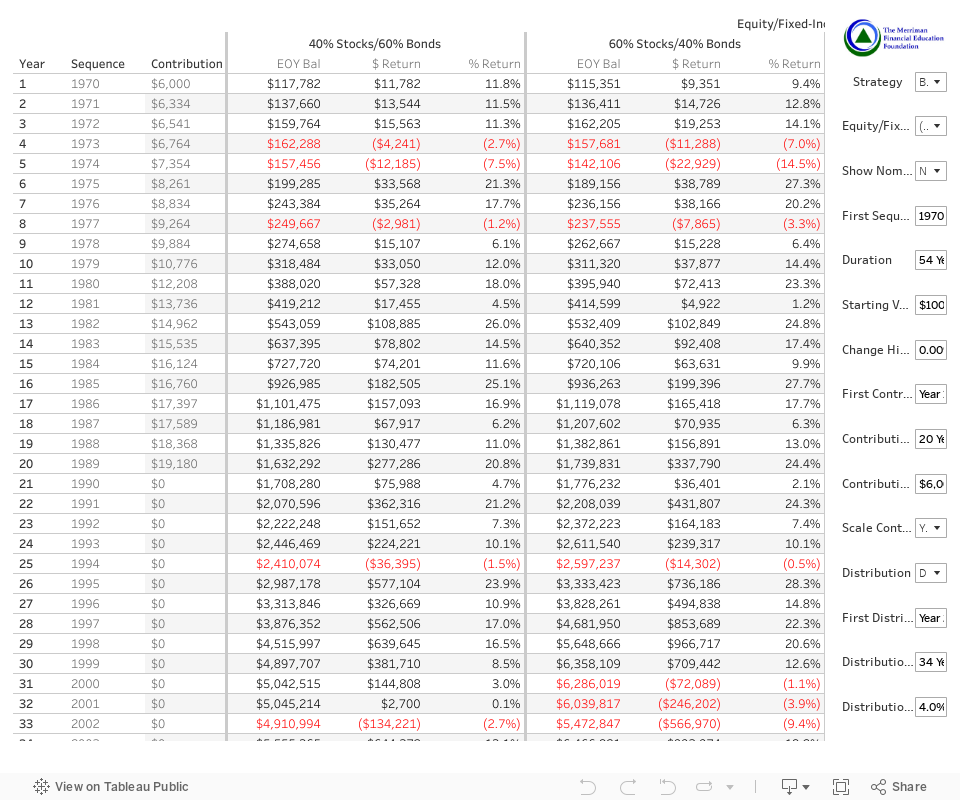
| Equity/Fixed Income | This toggles the columns, displaying from a 0% Stock/100% Bond portfolio to a 100% Stock/0% Bond allocation. | |
| Nominal or Real | Display the values of the table in future (nominal) or in today’s (real) dollars. | Nominal Real |
| First Sequence Year | This is the first year in your sequence of returns. For example, you can simulate how your portfolio would have performed just before major bear markets (1973-1974, early 2000s). | 1970 – 2023 |
| Duration | The total number of years to display. | 1-200 |
| Starting Value | A lump sum value to start with. | Minimum of $0 |
| Change Historical Returns By | Adjusts the historical return by the input value. For example, if the return is -5% in a given year and you enter -1%, the calculated return will be -6%. | -100% to 100% |
| First Contribution Year | This is the first year of contributions. | 1-200 |
| Contribution Duration | This is the duration of your contributions. | 0-200 |
| Contribution Amount (Nominal) | This is the nominal amount to be contributed at the beginning of the year. | Minimum of $0 |
| Scale Cont./Dist. w/ Inflation | This allows you to scale your contributions and distributions with inflation so you can contribute or distribute the same real value each year. | Yes No |
| Distribution | This toggles the table between showing growth and columns ($ Return & % Return) to showing either fixed or flexible distributions. | Don’t Calculate (Don’t calculate the distribution columns) Fixed: % Start Val Flexible: % Portfolio Val |
| First Distribution Year | The first year that you will start taking a distribution. This field is ignored if Distribution = “Don’t Calculate”. | 1-200 |
| Distribution Duration | The number of years you wish to take a distribution. This field is ignored if Distribution = “Don’t Calculate”. | 1-200 |
| Distribution % | Percent to take for your fixed or flexible distribution. Fixed distribution calculates the percent in the first distribution year. Flexible distribution calculates the percentage taken each year. Fixed distribution can be scaled with inflation by selecting “Yes” in the Scale Cont./Dist. w/ Inflation parameter. This field is ignored if Distribution = “Don’t Calculate”. | Minimum 0 |
Videos
The following videos are available on our YouTube Channel:
- Launch Video (Paul, Chris, Daryl and Craig)
- Lifetime Investment Calculator Detailed Overview
- Strategy Deep Dive
- Journey to Financial Independence
- The Evidence (Part 1) That 12 Simple Ways Can Supercharge Your Retirement
- The Evidence (Part 2) That 12 Simple Ways Can Supercharge Your Retirement
Frequently Asked Questions
Where do you get the underlying data?
The dashboard is created based on the 2024 fine tuning tables (1970 -2023). We have 54 years of data, which we loop through so that one could evaluate up to 200 years of returns.
Why does the calculator loop back to 1970 after 2023?
We only have 54 years of data from 1970 – 2023. We thought it would be useful to support looping through the sequence of returns so that one could see change over multiple generations. You can choose any starting year known sequence of returns and it loops back to 1970 after the year 2023.
What assumptions were made in this calculator?
All contributions are added at the beginning of the year.
All distributions are taken at the beginning of the year.
Where are inflation calculations from?
Inflation calculations is based on the historical US Consumer Price Index for the sequence year.
How can I download the table to Excel?
Each sheet can be downloaded to Excel using the download button embedded from Tableau. The “Crosstab” option is the best for exporting a view similar to the visualization.
I found an issue with the Lifetime Investment Calculator. What should I do?
Please email craig@paulmerriman.com for any technical issues.
The Merriman Online Calculator is built using Tableau Public.
How can I embed the dashboard in my website?
We appreciate your interest! Please link to this page where possible. It will always contain updates.
Why did you choose a maximum of 200 years?
It felt like one could model multiple lifetimes across a 200-year time horizon. This was inspired by Benjamin Franklin’s 200-year bequeathment to the cities of Boston and Philadelphia.
How are expenses handled in the calculator?
The Fine Tuning tables include adjustments for expenses. We used real expenses when we had the data and estimated expenses when we didn’t.
The red text color signifies that the previous year’s EOY balance is greater than the current year’s EOY balance.
Can you change the left "Year" column to show the actual year (i.e. 2023)?
We discussed this extensively during the creation process. We purposefully chose not to show future years because this tool isn’t able to predict anything. The lifetime investment calculator loops through the sequence of returns once it hits the year for which we have data.
Why is the distribution $ amount constant every year when you chose “Real” instead of “Nominal“?
Contributions and distributions are flat in real terms if the field labeled “Scale Contr./WDL w/ Inflation” is set to “Yes” and the “Nominal or Real” is set to “Real.” Contributions and distributions decline if you don’t scale with inflation because you have less purchasing power each year. If you keep up with inflation, your purchasing power is the same.
How does the Change Historical Returns By field work?
This field takes an input value between 100% and positive 100%. The value you enter will be added to the value of the return for all years. If you enter -10%, it will reduce the return by 10% in all years. If the return in a given year is -5%, the calculated value in that year will be -15%.
How do contributions work when "Real" is chosen?
The Contribution Amount (Nominal) parameter is always entered in nominal dollars. The contribution amount automatically adjusts in the table in real terms relative to the first year of the table. So, if you start the evaluation in year 1 and choose to start contributions in year 10, the first contribution amount will be displayed in year 1 dollars, adjusting the contribution for inflation.
This ensures the behavior mimics what is done when choosing Nominal. If you add the contribution amount (nominal) in year 10, they are added in year 10 dollars and adjust for inflation thereafter.
Updates
2024-05-28
- Launched the 2024 calculator update based on the 2024 Fine Tuning tables. The table numbers are different this year.
- Updated the default values to reflect a 54 years duration and a 34 year distribution duration.
2022-02-16
- Added the 2022 Fine Tuning tables. The table numbers are different this year and we add two new tables.
- Updated the default values to reflect a 52 year duration and a 32 year distribution duration.
2021-09-01
- Fixed the 1970 CPI and real return which was understating inflation in 1970 by about 5%.
- Significantly improved inflation calculations in real terms.
- Contributions and distributions remain the flat when Nominal or Real = "Real" and Scale Cont./Dist. w/ Inflation = "Yes" because purchasing power remains the same in real terms if you scale contributions and withdrawals with inflation.
- Contributions and distributions decrease when Nominal or Real = "Real" and Scale Cont./Dist. w/ Inflation = "No" because purchasing power decreases when you don't scale with inflation.
- Fixed a calculation in the presentation of real contributions and distributions which overstated the growth in real terms.
- Found and fixed rounding errors in the CPI calculation. This had an impact on real terms.
- Rounded underlying calculations to the nearest cent instead of the nearest dollar.
- Ending fixed distributions at $0 when you run out of money.
- Added bold vertical lines between equity and fixed income allocations for improved visibility.